Here’s what’s stopping Bitcoin’s price from surging past $82K on the charts

Bitcoin’s [$BTC] price may have briefly surged past $82,000 a few weeks ago. However, it has since failed to surpass this level. Instead, it has been trading within a sideways range between $76,000 and $82,000.
This is happening despite the presence of spot demand. Here’s why $BTC is stuck in this range and whether it can decisively break above $82K.
Bitcoin’s demand vs. heavy supply cluster
The spot demand for Bitcoin is coming from strong ETF inflows and large investors. For instance, the U.S Spot Bitcoin ETFs posted the strongest three-week stretch of 2026 after last week’s $986 million. This took the total net inflows to $3.80 billion.
Furthermore, Vivek Ramaswamy’s Strive purchased 1,375 $BTC worth $105 million. They could increase this position to 20K $BTC before the end of the year.
The derivatives market also contributed to $BTC’s recovery as Binance’s Open Interest hit a six-month peak of $10 billion.
However, buyers and sellers have been battling for control in the $76K-$82K range, which is one of the strongest supply zones. This level is a key demand zone, with 35% of $BTC’s supply bought at this level or higher.
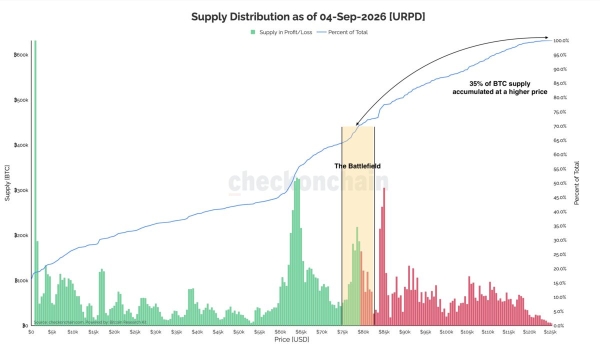 Source: Checkonchain
This heavy supply also came from the weekly average exchange net inflows, which increased by more than 593 $BTC. Thus, Binance’s $BTC reserves have remained high, roughly 685K–687K $BTC, indicating that the spot demand may be relatively low.
Moreover, the unrealized profits of short-term whales hit a record $9 billion, from a drawdown of about $5 billion one month ago. This increases the risk of a sell-off due to profit-taking.
Still, bulls and bears are yet to settle scores and confirm a price breakout.
Analyzing Bitcoin’s liquidity clusters
Looking at the liquidity, there seemed to be a massive cluster leveraged to the upside at press time. It was five times larger than the cluster sitting below $60,000.
Clearing this upside liquidity could trigger a short squeeze, helping $BTC stay above $82K. This move might be likely because the larger liquidity cluster was closer to price compared to the one below.
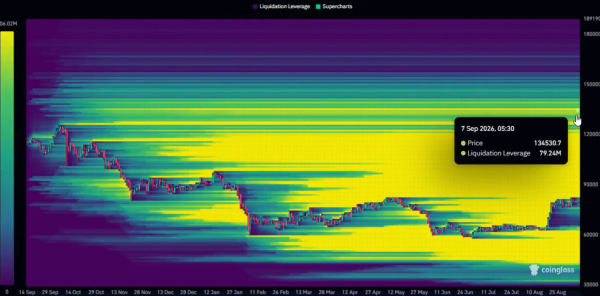 Source: CoinGlass
Is $BTC’s bottom in?
Finally, the technical outlook reinforced Bitcoin’s strength on the charts. Every time $BTC had two consecutive red 6-month candles, its market structure flipped bullish.
At the time of writing, the crypto was forming a bullish candle. This suggested that the second half of the year could close green.
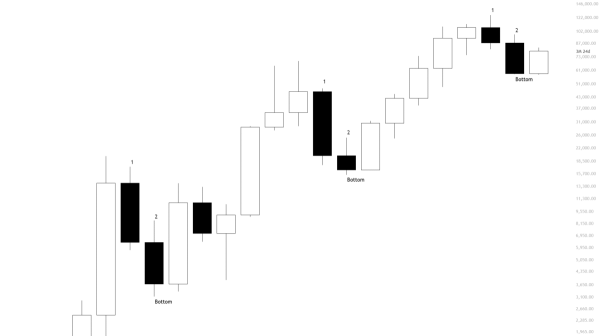 Source: $BTC/USD on TradingView
Since history does not always repeat but rhymes, the price may even surpass the ATH of $126K.
Final Summary
- Derivative traders, large investors, and institutional inflows in the form of Spot $BTC ETFs have driven Bitcoin’s demand.
- $BTC’s price action hinted at a potential bottom, but heavy supply above $82K could cap the uptrend.