Bitcoin Slips Below $81,000 After Wall Street Close: Is $80K the Next Liquidity Target?

Bitcoin slipped beneath $81,000 after Friday’s Wall Street close, reopening a support test that began earlier in the week. $BTC touched $80,401 during the 23:00 UTC hour, then recovered toward $80,810 early Saturday.
The latest four-hour snapshot subsequently placed Bitcoin near $80,571, below Thursday’s $80,789 low. The sequence initially resembled a liquidity sweep, with prices briefly reclaiming the previous low.
However, the subsequent decline left that recovery unconfirmed. This $BTC price analysis identifies $80,000 as the nearest psychological level, although no single overnight catalyst has been established. Weekend trading typically brings thinner liquidity.

Know when your
coins move
Alerts, real-time prices, and market news — all in one app  Point your phone camera to install
 4.8 based on 40K reviews in the App Store and Google Play


| Level | Technical Significance |
| $82,004 | Four-hour EMA resistance |
| $81,156 | Fibonacci midpoint |
| $80,789 | Thursday’s low |
| $80,408 | Breakdown confirmation level |
| $80,000 | Psychological liquidity target |
| $79,688 | Next Fibonacci support |
Bitcoin Slips Below $81K as $80K Liquidity Comes Into Focus
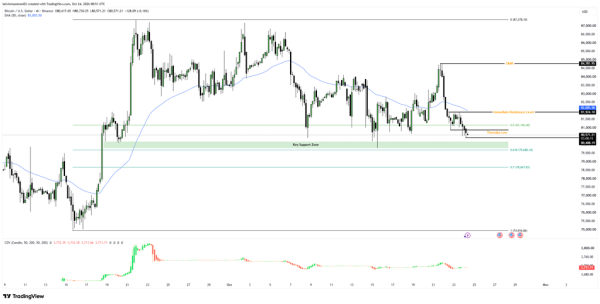
The Binance chart records a reversal from approximately $84,782, followed by lower highs toward the $80,408–$80,000 support zone. Bitcoin remained below the $81,156 Fibonacci midpoint and its descending 50-period exponential moving average near $82,004.
 Source: TradingView
In the $BTC price analysis framework, that average now marks overhead resistance rather than support. Another $BTC price analysis reference is $80,408, where a four-hour close beneath support followed by a failed retest would strengthen bearish confirmation.
Below that area, the chart marks $79,688 at the 0.618 retracement and $78,668 at 0.7. For now, Bitcoin has tested support without establishing a confirmed four-hour breakdown.
Follow us on X for real-time crypto updates.
Four-Hour CVD Flattens as $635.6M ETF Outflows Add Context
Meanwhile, the four-hour cumulative volume delta (CVD) has flattened near 3,712 following its October 21 rise. Although $BTC recorded a fresh local low, CVD did not register a similarly sharp decline. That divergence does not establish accumulation.
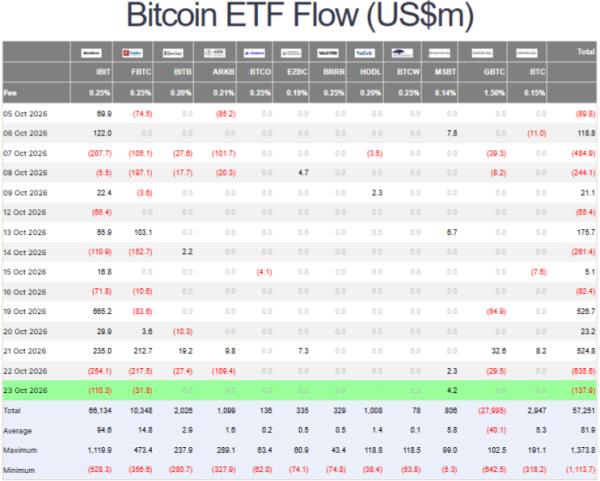
Rather, the $BTC price analysis distinguishes a potential sweep from continuation through subsequent price action and trade flow. Beyond the technical indicators, Thursday’s U.S. spot Bitcoin ETFs recorded $635.6 million in outflows. However, Friday’s early readings remained incomplete, leaving fund flows unverified as the overnight cause.
 Source: Farside Investors
Therefore, recovery above $80,789 and $81,156 would challenge the downside setup. Until then, $BTC price analysis centers on $80,000, $81,924, and the four-hour average mark resistance before October 28’s Fed decision.
Four-Hour Market Indicators
| Indicator | Latest Reading |
| $BTC price | $80,571 |
| CVD | Approximately 3,712 |
| Price structure | Lower highs |
| ETF outflows | $635.6 million Thursday |
| EMA positioning | Price below 50-period EMA |
Bullish Recovery Case
Reclaiming $80,789 and $81,156 would support the liquidity-sweep interpretation, exposing $81,924 and $82,004.
Bearish Continuation Case
A four-hour close below $80,408, followed by a failed retest, would strengthen downside confirmation toward $80,000 and $79,688.
FAQs
1. Is $80,000 Bitcoin’s Next Target?
For now, $80,000 is the nearest major psychological level below the market.
2. What Confirms Bearish Continuation?
A four-hour close under $80,408, followed by a failed attempt to reclaim it.
3. What Invalidates the Bearish Setup?
Bitcoin holding above $81,156 would put the immediate bearish case in doubt.
4. Does CVD Confirm Aggressive Selling?
Not quite. CVD has leveled off, with little sign of selling pressure picking up again.
Subscribe to our YouTube channel for the latest crypto news.
Related: Bitcoin Price Analysis: $BTC Risks Dropping Below $79K After Second-Week High Sweep