Bitcoin nears a bottom before U.S. midterms: What history and on-chain data suggest

The link between activity in the U.S. and the broader crypto market has strengthened in recent months, particularly as domestic economic factors such as interest rates and inflation, along with U.S.-linked crypto assets, have grown increasingly influential.
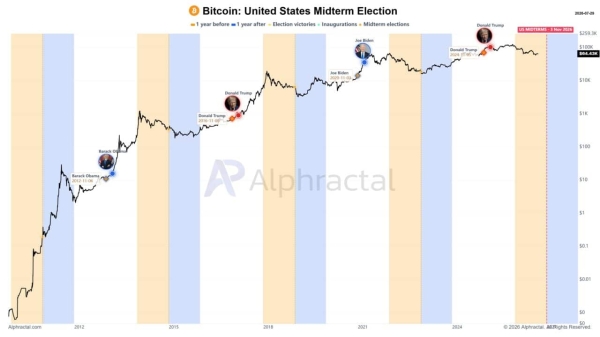
One of the clearest links right now is the correlation between Bitcoin [BTC] and the upcoming U.S. midterm elections, which have historically served as a proxy for identifying the market bottom, as they have in past cycles. The reaction from U.S. investors so far has stayed measured.
Bitcoin could stall or drop before the vote
Historical referencing using the U.S. midterm elections as a basis for correlation shows Bitcoin tends to decline in the year before the vote, forming a bottom in the process.
That bottom usually takes shape in the days before the midterm or shortly after, and the asset then tends to enter a year-long rally, at least according to those references.
The U.S. midterm elections take place halfway through a President’s term, when Americans choose members of Congress and other officials in a vote often determining whether the President will have an easier or harder time governing over the following two years.
 Source: Alphractal
That outcome often reflects the broader economic conditions in play during the period. The coming election is set for the 3rd of November, and if the fractal holds, there is a strong chance Bitcoin sees a firmer upswing.
The crypto market has yet to flourish under President Trump’s administration so far, held back by several factors, particularly oil-driven inflation concerns and tariff wars, which have escalated and tightened financial conditions across risk assets.
Bitcoin’s bottom looks close based on on-chain profits
On the on-chain front, other signals have hinted at the possibility of Bitcoin finding a bottom in the near to short term.
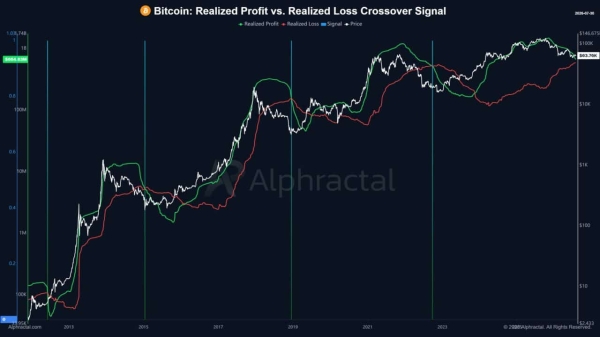
The on-chain analysis draws on profit realization, which tracks how much profit investors have taken on Bitcoin, and loss realization, which tracks the reverse, and together these metrics point to a high chance of a bottom forming.
Whenever the realized profit on Bitcoin crosses below the realized loss, it has historically marked the point where the market begins to set up for an uptrend.
 Source: Alphractal
At the time of writing, the chart shows the two lines on the verge of making that crossover once again, a move which could ignite a strengthening bullish run across the market.
Over the past four weeks, Bitcoin has been moving within a tight range, with the asset trading between $62,000 and $65,000 on the chart.
Where U.S. investor sentiment stands
Sentiment from U.S. investors has not been strong, as this group has barely allocated capital toward purchasing Bitcoin since July began.
SoSoValue reported the netflow from U.S. investors this month sits at around $204.67 million, a meager figure which shows there is still some interest in Bitcoin, though these investors are far from completely bullish on the asset.
If July closes at this level, it would mark the lowest monthly bullish netflow ever recorded in the market.
Final Summary
- Past midterm cycles show Bitcoin tends to bottom around the vote before a year-long rally, and if the pattern holds into the 3rd of November, the setup could repeat.
- On-chain profit and loss signals hint a bottom is forming, but soft U.S. buying through July leaves the move far from confirmed.