Bitcoin Rainbow Chart predicts BTC price for start of October 2026

The Bitcoin Rainbow Chart suggests BTC remains in historically undervalued territory heading into October 2026, with the cryptocurrency trading just above the model’s lowest valuation zone.
The Bitcoin Rainbow Chart is a long-term valuation model that uses logarithmic bands to show whether Bitcoin is trading in zones historically associated with accumulation, fair value, or market euphoria.
At press time, Bitcoin (BTC) was trading at $86,128, only slightly above the Rainbow Chart’s “Bitcoin is dead” band, projected at $84,124.72 for October 2, 2026.
According to the BlockchainCenter Rainbow Chart, the lowest band for October 2, labeled “Bitcoin is dead,” stands at $84,124.72. The next level, “Basically a Fire Sale,” is projected at $112,145.39, followed by the “BUY!” band at $149,519.46 and the “Accumulate” zone at $203,456.75.
Further up the scale, the “Still cheap” band is positioned at $279,713.75, while the “HODL!” zone sits at $385,875.50. Above these levels, the model enters increasingly speculative territory, with the “Is this a bubble?” band at $531,713.42, “FOMO intensifies” at $712,913.64, and “Sell. Seriously, SELL!” at $970,822.48.
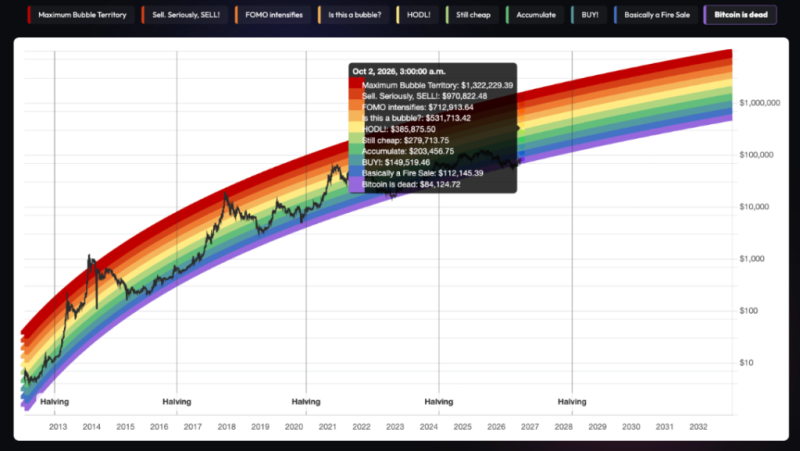
Bitcoin Rainbow chart. Source: Blockchain Center
At the top of the model sits the “Maximum Bubble Territory” band at $1.32 million. Historically, the upper red bands have coincided with periods of extreme optimism and cycle peaks, while the lower blue and purple zones have been associated with bearish sentiment and long-term accumulation.
Bitcoin price outlook
With Bitcoin trading at $86,128, the asset is positioned just 2.4% above the model’s lowest band. This places BTC well below the “Basically a Fire Sale” threshold of $112,145.39 and far beneath the chart’s mid-range valuation zones.
Based on the model, Bitcoin would need to gain roughly 30% to reclaim the “Basically a Fire Sale” band. A move into the “BUY!” zone would require a rally of about 74%, while reaching the “Accumulate” band would imply gains of more than 136% from current levels.
The chart therefore suggests Bitcoin remains closer to historical value territory than to the speculative conditions typically associated with market tops.
Overall, the Rainbow Chart’s positioning indicates that Bitcoin remains in a zone historically associated with pessimism and accumulation.
While the indicator does not generate a specific price target, its October 2026 projections suggest BTC would first need to reclaim $112,145 before moving toward the higher valuation bands that have historically accompanied stronger bull-market phases.
Featured image via Shutterstock