‘Bull Market Confirmed’: Analyst Flags Bitcoin’s Fifth Historic Signal
Bitcoin’s Fifth Bull Market Signal
Bitcoin’s latest signal reflects a change in what newer and longer-standing holders paid for their coins, according to an analysis by Cryptoquant contributor Darkfost published on Sept. 24. He interprets the shift as confirmation of the recovery he anticipated when a separate signal appeared on July 11.
In a post on X, the analyst wrote:
“Bull Market Confirmed … This is the 5th occurrence, which gives a bit more credibility to the dynamic bitcoin is putting in place, though there’s always a margin for error, and I prefer to point that out.”
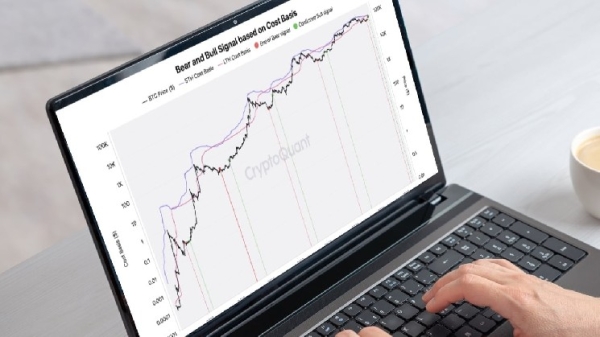
The measure compares cost basis, an estimate of the average price paid, across two groups of holders. Its bullish signal occurs when the short-term holder cost basis crosses above that of active long-term holders. The chart identifies four previous signals in 2012, 2015, 2019, and 2023; the latest crossover is the fifth in that series.
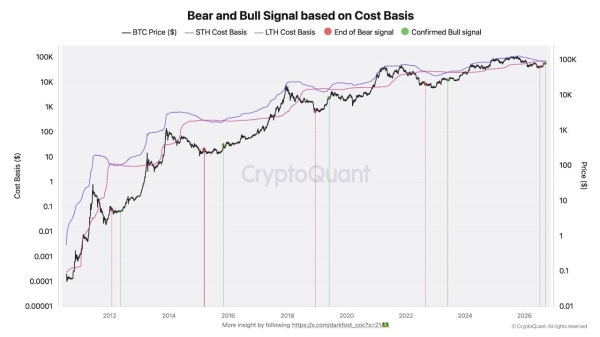 Cryptoquant’s chart marks the latest crossover as a confirmed bull signal. Source: Cryptoquant.
Why the Long-Term Holder Measure Excludes Dormant Coins
The comparison depends on which coins enter the long-term holder calculation. The analyst counts coins that have moved at least once during the past seven years, excluding older supply that has remained untouched throughout that period. He considers this a more coherent measure of active holders while acknowledging that the seven-year cutoff is arbitrary.
The activity filter serves a different purpose from the distinction between newer and older holders. Glassnode’s holder definitions use an approximate 155-day holding period to separate short-term from long-term supply. The additional seven-year test determines which long-term coins contribute to the active-holder cost basis.
More than 3.5 million $BTC older than 10 years remains dormant, according to the post. He estimated that the amount grows by roughly 8,000 to 30,000 $BTC a month. Its monthly change has turned negative only once since 2019, after an old miner moved about 100,000 $BTC. Bitcoin from wallets inactive for five to 15 years moved again in 2026, showing why the analysis distinguishes dormant coins from active holdings.
ETF Demand Adds to the Bull Market Case
The analyst links the change in bitcoin’s momentum partly to liquidity entering through exchange-traded funds (ETFs). U.S. spot bitcoin ETFs took in $2.06 billion from Sept. 21 through Sept. 23, according to Farside’s daily flow data. Each session brought net inflows, although the daily amounts declined. The figures show fund demand during the period of the signal; they do not establish that ETF buying caused the crossover.
The three-day stretch began with the funds’ largest single-day inflow of 2026: $999 million on Sept. 21. Net inflows then eased to $714.7 million on Sept. 22 and $346.9 million on Sept. 23. The sequence lends context to the liquidity argument while showing that the pace of buying slowed after the record day.
A spot bitcoin ETF gives investors exposure through shares of a fund that holds bitcoin, rather than through coins held in their own wallets. Investors can trade those shares through a brokerage account. This ETF structure provides one route through which institutional and other fund investors can participate in the market.
A separate Cryptoquant outlook places that participation within a longer market cycle. In a Sept. 22 assessment, founder and CEO Ki Young Ju argued that a larger market and growing institutional ownership could temper the extreme rallies and crashes of earlier cycles. He forecast threefold to fivefold returns for bitcoin this cycle, followed by a milder bear market.