Ethereum tipped to hit $7,000 by this date

As Ethereum (ETH) seeks to reclaim the $2,500 resistance, a new technical analysis suggests the second-largest cryptocurrency could hit $7,000 by mid-August 2028, representing a potential gain of more than 350%.
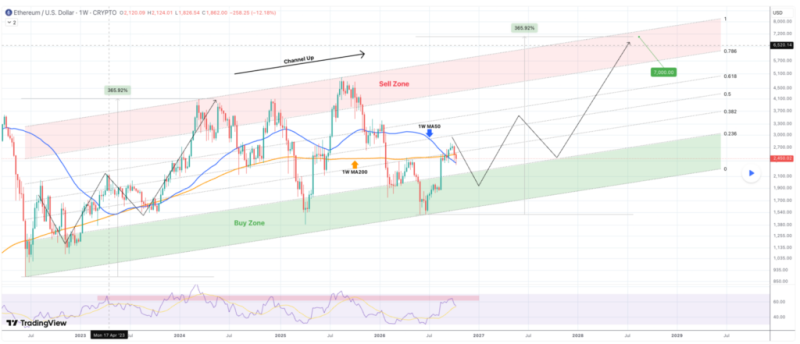
Specifically, TradingShot outlined the forecast in a TradingView post on October 16, predicting a new bull cycle after ETH broke above its 50-week moving average (MA) and ended the lower-high sequence that characterized its 2025–2026 downturn.
The forecast is based on a four-year ascending channel that projects a 365.92% gain from the cycle bottom to $7,000.
TradingShot identified the 0–0.236 Fibonacci range as the buy zone and the 0.786–1 range as the sell zone, placing the target near the channel’s upper boundary.
ETH price analysis chart. Source: TradingView
However, the analyst expects an initial pullback, with the weekly relative strength index (RSI) facing resistance and signaling potential near-term weakness.
If ETH establishes a higher low and resumes forming higher lows and higher highs, it would reinforce the bullish pattern.
However, a break below the channel’s lower boundary would weaken the outlook and threaten the $7,000 target.
Ethereum network activity
At the same time, Ethereum’s technical outlook could be supported by ongoing network upgrades designed to improve scalability, usability, and security.
The Fusaka upgrade, activated on December 3, 2025, introduced PeerDAS to reduce validator bandwidth requirements and support greater layer-2 data capacity.
The next major upgrade, Glamsterdam, is targeted for the fourth quarter of 2026, with planned improvements to transaction processing and parallel execution.
These developments could strengthen Ethereum’s role in decentralized finance (DeFi), stablecoins, and tokenized assets. However, their impact on ETH will depend on whether greater network capacity generates sustained demand for block space and the token.
TradingShot’s forecast ultimately depends on Ethereum maintaining its ascending channel. Macroeconomic conditions, competition from rival blockchains, and weaker investor sentiment could derail the rally.
A pullback would not necessarily invalidate the prediction if ETH establishes support and resumes its upward trend.
Ethereum price analysis
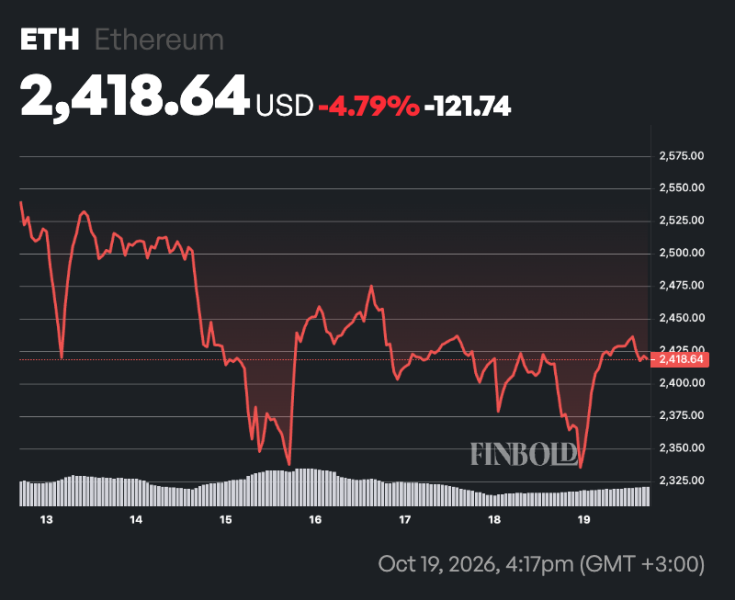
By press time, ETH was trading at $2,425, up 0.5% over the past 24 hours but down 4% over the week.
ETH seven-day price chart. Source: Finbold
Ethereum remained below its 50-day simple moving average (SMA) of $2,550.51, indicating continued short-term bearish pressure. However, it was above its 200-day SMA of $2,147.36, suggesting the longer-term trend remains supportive.
The 14-day relative strength index (RSI) stood at 38, signaling weakening momentum but remaining above the oversold threshold of 30.
A move above the 50-day SMA could signal a recovery, while a decline toward the 200-day SMA would expose ETH to further downside.
Featured image via Shutterstock