Fidelity Points to October Bitcoin Bottom Signal as Key Market Indicator Hits Historic Low

- Bitcoin’s Yardstick indicator remained in the undervaluation zone for 83% of the past 92 days.
- The network’s processing power (hash rate) recorded a 22% drop from its all-time high.
- The realized cap ratio between long-term and short-term holders reached a reading of 3.9 points.
Fidelity Digital Assets identified patterns suggesting the formation of a projected Bitcoin bottom toward the month of October. The firm presented these technical observations after detecting historic lows in key On-Chain valuation metrics during the third quarter.
Two signals we’re watching are approaching significant levels.
BTC’s Yardstick is hovering near historic lows, while several sentiment indicators are approaching capitulation territory.
Could the market be nearing a bottom?
Explore the data in our Q3 2026 Signals Report… pic.twitter.com/XsliCQG9Lx
— Fidelity Digital Assets (@DigitalAssets) July 28, 2026
Analysis of the Yardstick Indicator and Cycle Dynamics
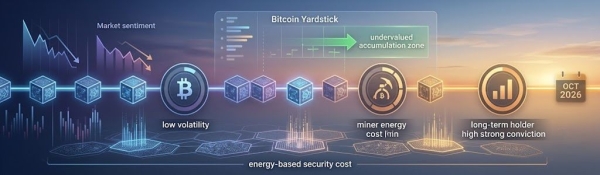
The Yardstick indicator evaluates the relationship between the network’s market capitalization and its processing rate using a normalized Z-score. A value below -1 standard deviation signals an undervalued state for the asset relative to the energy consumption invested in securing the chain.
According to Fidelity’s report, the asset is trading at a significant discount relative to the energy cost used by miners. The financial institution highlights that the index remained at discounted levels for 76 out of the past 92 days analyzed.
Mining companies experienced financial pressure due to lower market prices. However, the network’s computing capacity only dropped 22% from its previous peak levels.
Fidelity’s report reveals that the maturation of the mining industry allowed for stronger management of operational efficiency during the current period. Firm analysts note that price swings in this cycle exhibit lower historical volatility than in previous stages.
Previous accumulation phases maintained undervaluation ranges for an average of 300 days in prior cycles. The current bear market has lasted 203 days up to the publication of the asset manager’s official report.
Based on Fidelity’s projections, October 2026 emerges as a key timeframe for analysts focused on cyclical behavior. The firm maintains that several sentiment indicators remain close to capitulation zones.
Long-Term Holder Accumulation and Technical Structure
The realized capital metric between long-term holders (LTH) and short-term holders (STH) registered a level of 3.9 points. Historically, readings above the 4.0 threshold preceded definitive bottoms in previous market cycles.
Data presented by the Alphractal portal suggests that capital concentration is shifting toward investors with long-term conviction horizons. Short-term speculative participation remains reduced in the most recent on-chain records.
According to statements by Joao Wedson, founder of Alphractal, the current structure places the market in an advanced accumulation phase. The firm’s metrics point to an approach toward a range historically defined as a major support zone.
Bitcoin’s price pulled back 5.5% from its five-week high of $67,000 reached on July 21. During Tuesday’s session, the price dipped slightly below the $63,000 mark.
The pioneer cryptocurrency attempted to break through the $64,000 resistance on three separate occasions over a 12-hour span. These attempts failed to consolidate a breakout above that technical range.
Reports from the firm Swissblock detail that the market’s reconstruction phase encountered obstacles in regaining buying momentum. The price structure shows signs of stabilization, although buying volume has not expanded sufficiently to sustain an upward trend.
On-chain data monitoring will keep its focus on the evolution of hash rate and variations in operational costs across the mining sector.