Waiting for a 30% Bitcoin Dip Backfired in 61% of Tested Cases
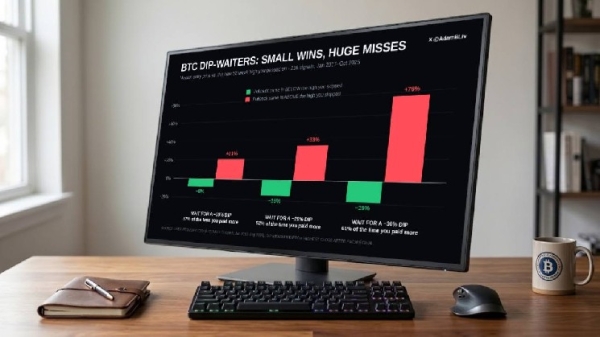
Why a Bitcoin Crash Still Led to a Higher Purchase Price
A bitcoin buyer could wait for a 30% crash and still pay more than at the price they first rejected. That was the result in 61% of the cases Adam Livingston, vice president of investments at Strive Inc. (Nasdaq: ASST), a bitcoin treasury company, examined. In a Sept. 27 post on X, he shared his analysis of bitcoin dip buying. His test starts at each of 216 new 52-week closing highs from January 2017 through October 2025, then models waiting for a pullback before buying.
The distinction is where the decline begins. Bitcoin can climb well beyond an earlier high before falling 30% from a later peak. In Livingston’s test, that drop took 134 days at the midpoint of the waiting times to arrive and up to 881 days. The pullback occurred, but its eventual purchase price was often above the original opportunity.
Livingston illustrated the result with an August 2020 starting price of $12,300. Under his 30% pullback rule, the modeled purchase came at $43,580, about 254% higher. The example captures his central point: the size of a fall from a later peak does not establish whether bitcoin has returned to an earlier price.
More Than Just News
Content, live market tracking, portfolio management, and price alerts — everything you need in the Crypto News app.
Download now, stay on top of the crypto market, and take control of your information. 

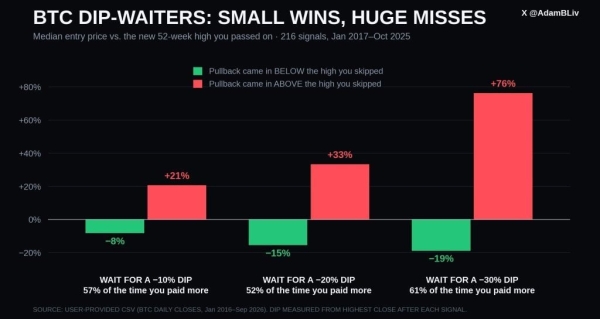 Adam Livingston’s test of 216 new 52-week bitcoin closing highs shows that waiting for a 30% dip led to a higher modeled purchase price in 61% of cases. Source: Adam Livingston/X.
Even Smaller Bitcoin Dips Often Failed to Beat the Earlier Price
The same pattern appeared with smaller declines, though the waiting periods were shorter. A 10% dip arrived after a median 14 days, yet the modeled entry exceeded the skipped price in 57% of cases. A 20% drop took a median 44 days and produced a higher entry in 52%. Blackrock notes that bitcoin’s periods of strong performance have come with significant volatility.
The chart separates cases where waiting helped from those where it failed. For the 30% rule, the median entry was 19% below the original high when the strategy secured a lower price. When it produced a higher price, the median entry was 76% above that high. Such different outcomes reflect bitcoin price volatility, the speed and extent of price changes. Those figures describe outcomes within Livingston’s historical test, not gains or losses from actual investor trades.
His calculation depends on daily closing prices and a particular rule for measuring a dip from a subsequent high. Closing prices can also vary by data source and time of day. For example, CF Benchmarks calculates a daily bitcoin reference price from trades across multiple exchanges at the New York market close. Livingston’s 216 signals may include nearby highs from the same rally, so the percentages should not be read as 216 independent market cycles.
Bitcoin’s 2025 Peak Shows Both Sides of the Trade
Waiting has sometimes produced a substantially lower entry. Bitcoin reached a record above $126,000 in October 2025 before a prolonged decline. That reversal illustrates the risk faced by someone who bought near a high rather than waiting for a deeper correction.
By June 30, bitcoin had fallen below $58,000, less than half its October peak. A buyer who waited from that peak could have found a lower price. That outcome coexists with Livingston’s finding: his percentages compare each eventual entry with its own starting high, across a selected set of signals.
Bitcoin remained about 33% below its October record on Sept. 26, despite recovering from its June low. It traded near $84,162 that morning after retreating from a September high of about $87,374. From the June low of about $57,735, bitcoin had rebounded roughly 46% by Sept. 26.