Decoding Bitcoin’s September trap: Is drop to $52K looming for BTC?

Are Bitcoin investors falling for the market’s “September Trap”?
In terms of positioning, traders are becoming more long biased on Bitcoin, implying they expect a bullish move that the technical formation has yet to confirm.
Because from the technical standpoint, $BTC has been trading below $80k for more than two weeks, which keeps the risk/reward equation in check.
However, the setup on the chart below implies that the bulls are willing to risk a lot for a big reward.
According to CoinGlass data, Bitcoin’s funding rates are positive, and the long/short ratio has jumped to 1.08 from below 1 over the past week. Moreover, it is the highest ratio of long positions since the mid-August cycle.
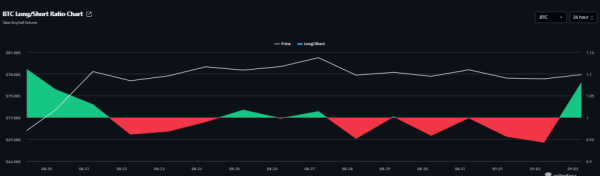 Source: CoinGlass
In essence, the traders are expecting a breakout above Bitcoin’s current resistance.
However, it must be noted that not everyone is optimistic.
An analyst on X posted asking for a $BTC short, claiming that $BTC could reach the $52k level and then turn around and head back up. This divergence in viewpoints can only contribute to $BTC price’s volatility and put more pressure on its current consolidation.
In this context, it becomes critical to take a closer look at the on-chain situation. And so far, it’s suggested that there is even a clear bias forming.
The catch, though? Either way, Bitcoin [$BTC] stands at serious risk of creating a September trap.
Bitcoin rally meets weak sentiment
Bitcoin enters September with bearish positioning and weakening market signals.
According to Santiment data, Bitcoin closed August nearly 25% higher than it opened; however, the sentiment did not follow suit. $BTC price climbed from roughly $64.7k to $78.3k, marking one of its strongest August performances.
And yet, Santiment’s Sentiment Balance averaged only +32, compared to +72 that was recorded in July, when Bitcoin traded at around $63k. So, in contrast to the strong rally, market participants remained rather bearish.
While this alone supports the ongoing “September trap” narrative, $ETH/$BTC is adding yet another layer to the setup. The pair closed the month above its 20-month moving average, which suggests that Ethereum could be gaining momentum against Bitcoin.
If this trend holds, Bitcoin dominance could come under further pressure, creating another headwind for $BTC in September.
 Source: X
With this in mind, the analyst’s Bitcoin short call makes more sense. Weaker on-chain data, negative sentiment and a stronger $ETH/$BTC setup point to more downside risks for $BTC.
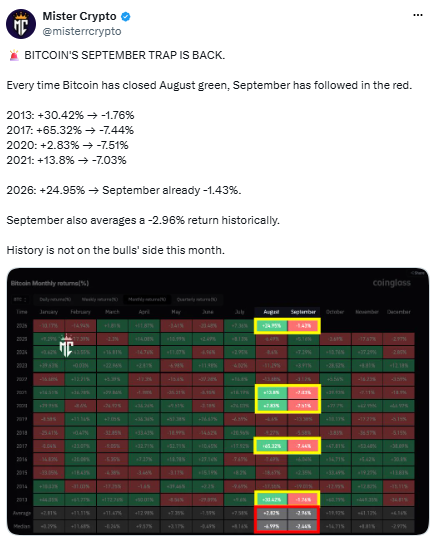
So, could this positioning be an early signal that Bitcoin’s “September trap” is in play? As the chart above shows, bullish Augusts have often set the stage for a weaker September. Should this be a repeat performance, then $BTC could face another correction as the month progresses.
Final Summary
- Bitcoin rallied in August, but weak sentiment and on-chain data are raising downside risks.
- With $ETH/$BTC gaining strength, $BTC could be heading into another “September trap.”